The Definitive Guide to UML
 by Guillermo Quiros
A reference-grade guide to understanding, applying, and mastering the Unified Modeling Language for software design and architecture.
Introduction: Why UML Exists
Software systems have always been complex. But for most of the early decades of computing, "complex" meant complex algorithms — sorting, searching, parsing, compressing. A single engineer could hold an entire program in their head. The challenge was writing correct, efficient code. Communication between engineers was secondary.
That world changed in the late 1980s and early 1990s. Software systems became organizationally complex, not just algorithmically complex. Programs were being written by teams of dozens or hundreds of engineers. Systems spanned thousands of classes, interacted with external databases and networks, and were meant to evolve over years. Correctness alone was no longer sufficient — the code also had to be understandable, maintainable, and communicable.
A new discipline emerged in response: object-oriented design. The central insight of object-oriented design was that complex systems could be tamed by modeling them as collections of interacting objects — each with its own state and behavior, each communicating through well-defined interfaces. Object-oriented languages (Smalltalk, C++, later Java) gave engineers the syntax to express this model in code. But syntax is not communication. Engineers still lacked a shared visual language for describing their designs before and independently of the code.
Multiple visual notations appeared in the late 1980s and early 1990s to fill this gap. Grady Booch developed the Booch method. Ivar Jacobson developed OOSE (Object-Oriented Software Engineering), introducing the influential use case concept. James Rumbaugh developed OMT (Object Modeling Technique). Each notation had real strengths, enthusiastic communities, and fierce advocates. Each also had real weaknesses, idiosyncratic choices, and limited interoperability.
The result was a fragmented landscape where different teams, organizations, and tools used incompatible visual languages. A design document created using Booch notation was unintelligible to an engineer trained in OMT. The field needed unification.
The Three Amigos and the Birth of UML
In 1994, Grady Booch and James Rumbaugh joined Rational Software and began working together to unify their methods. Ivar Jacobson joined Rational in 1995, and the three — nicknamed the "Three Amigos" — produced the first version of UML (the Unified Modeling Language) in 1996. The Object Management Group (OMG) standardized UML 1.1 in 1997. UML 2.0 was published in 2005 with significant expansions to the notation and diagram types. The current version is UML 2.5.1, published in 2017.
UML has since become the most widely adopted visual language in software engineering. It is taught in virtually every computer science curriculum, supported by hundreds of tools, and referenced in countless textbooks, standards, and certification programs.
Understanding UML deeply — not just its notation, but its philosophy, its diagram types, its appropriate applications, and its limitations — is a fundamental skill for any serious software engineer or architect.
What Is UML?
The Unified Modeling Language (UML) is a standardized visual language for specifying, visualizing, constructing, and documenting the artifacts of a software system.
Several aspects of this definition deserve unpacking.
Standardized. UML is a formal standard, governed by the Object Management Group. Its notation is precisely specified in a formal specification document. This means that a UML class diagram drawn in Tokyo means exactly the same thing as one drawn in Berlin — assuming both are drawn correctly. This degree of standardization distinguishes UML from informal notations like C4, which are conventions rather than standards.
Visual language. UML communicates through diagrams — boxes, arrows, and a specific set of symbols that carry precisely defined meanings. It is not a programming language, not a configuration language, and not a text-based specification format (although XMI, an XML-based serialization of UML models, exists for tool interoperability).
Specifying, visualizing, constructing, and documenting. These four verbs describe the range of UML's intended uses. UML can be used early in design to specify what a system should do and how it should be structured (specifying). It can be used to communicate design ideas visually (visualizing). In some cases — using model-driven development tools — it can be used to generate code (constructing). And it can be used to document systems that already exist (documenting).
Artifacts of a software system. UML is not limited to code structure. It can model requirements (use cases), dynamic behavior (sequence diagrams, state machines), physical deployment (deployment diagrams), and business processes (activity diagrams). It is a general-purpose modeling language that spans the entire software engineering lifecycle.
What UML Is Not
Understanding what UML is not is equally important.
UML is not a methodology. UML does not tell you how to develop software. It does not prescribe when to create which diagrams, in what order to proceed through a design, or how to organize a project. UML is a notation system that can be used within many different methodologies — RUP (Rational Unified Process), agile, waterfall, or ad hoc.
UML is not a programming language. UML cannot be compiled or executed (except in specific model-driven development contexts). A UML class diagram is a design artifact, not a deployment artifact.
UML is not always the right tool. UML is powerful and comprehensive, but it is also complex and can be heavyweight for small or informal communication needs. Knowing when UML adds value — and when a simpler notation or a whiteboard sketch is more appropriate — is part of using UML effectively.
The Structure of UML: Diagram Types
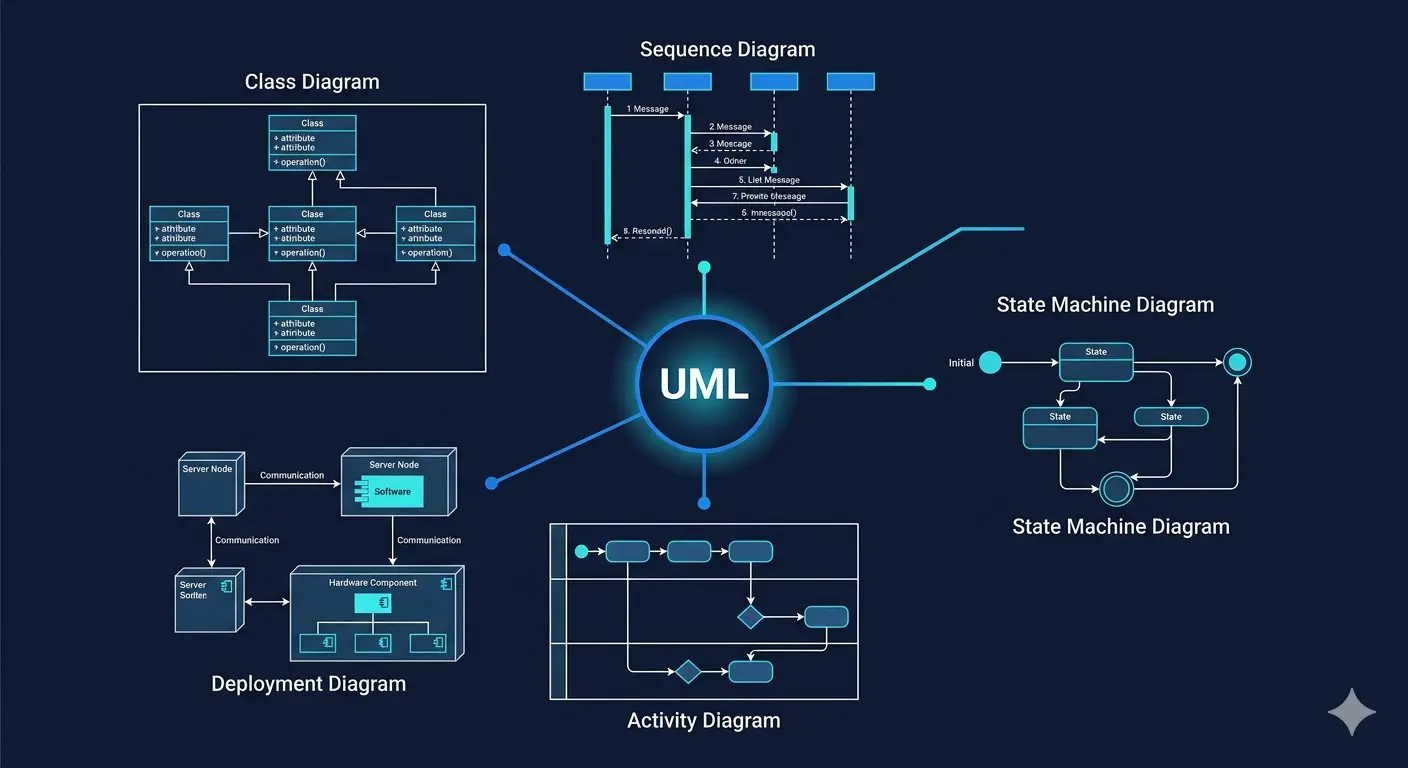
UML 2.x defines 14 diagram types, organized into two broad categories: structural diagrams and behavioral diagrams.
Structural Diagrams
Structural diagrams describe the static structure of a system — the things that exist in the system and their relationships to each other, independent of time.
There are seven structural diagram types:
- Class Diagram — The most widely used UML diagram. Shows classes, their attributes and methods, and the relationships between them.
- Object Diagram — A snapshot of the class diagram at a specific moment in time, showing specific object instances and their current attribute values.
- Component Diagram — Shows the software components in a system, their interfaces, and their dependencies.
- Composite Structure Diagram — Shows the internal structure of a class or component at runtime.
- Package Diagram — Shows the organization of model elements into packages and the dependencies between packages.
- Deployment Diagram — Shows the physical deployment of software artifacts onto hardware nodes.
- Profile Diagram — An extension mechanism for defining custom stereotypes, tagged values, and constraints.
Behavioral Diagrams
Behavioral diagrams describe the dynamic behavior of a system — how it changes over time and how its elements interact.
There are seven behavioral diagram types:
- Use Case Diagram — Shows the actors that interact with a system and the use cases (functional requirements) the system supports.
- Sequence Diagram — Shows the interactions between objects over time, emphasizing the sequence of messages.
- Communication Diagram — Shows the same information as a sequence diagram but organized around the structural relationships between objects rather than time.
- Activity Diagram — Shows the flow of control or data in a system, similar to a flowchart but with additional expressive power.
- State Machine Diagram — Shows the states an object can be in, the events that trigger transitions between states, and the actions that occur during transitions.
- Interaction Overview Diagram — A high-level diagram that shows a sequence of interactions, where each step can itself be a sequence diagram.
- Timing Diagram — Shows the behavior of objects over time, focusing on the temporal constraints between events.
In practice, not all 14 diagram types are equally useful or commonly used. The following sections focus on the seven most widely used and most practically valuable diagram types, with in-depth coverage of each.
Class Diagrams
Purpose
A Class diagram is the cornerstone of structural UML modeling. It answers the question:
What are the entities in this system, what do they know, and how are they related?
Class diagrams are used at multiple stages of the software development lifecycle: in early design to define the domain model, during detailed design to specify class structure before coding, during code review to verify that the implementation matches the design, and as documentation to record the structure of an existing system.
They are the diagram type that most engineers encounter first when learning UML, and the one that has the most direct correspondence to object-oriented code.
Elements of a Class Diagram
Classes. A class is represented as a rectangle divided into three horizontal compartments:
- The top compartment contains the class name, centered and bold
- The middle compartment contains the attributes (fields) of the class
- The bottom compartment contains the operations (methods) of the class
The name compartment is mandatory. The attribute and operation compartments can be omitted if not relevant to the level of abstraction being communicated.
Attributes. Each attribute in the middle compartment is written as:
visibility name : type [multiplicity] = defaultValue
For example: - balance : Decimal [1] = 0.00
Visibility is indicated by a prefix symbol:
+Public-Private#Protected~Package (default in Java)
Operations. Each operation in the bottom compartment is written as:
visibility name(parameterList) : returnType
For example: + withdraw(amount : Decimal) : Boolean
Abstract classes and interfaces. Abstract classes are shown with the class name in italics. Interfaces are shown with the «interface» stereotype above the class name. Both can also be shown with a notation keyword in the name compartment.
Relationships Between Classes
UML defines six distinct relationship types for class diagrams, each with a specific semantic meaning and a specific visual notation.
Association. The most general relationship type. Indicates that one class is connected to another in some way — typically that instances of one class "know about" or "can interact with" instances of another. Drawn as a solid line between the two classes. Associations can be labeled with the nature of the relationship and can show multiplicity at each end.
Example: A Customer class is associated with an Order class. A customer can have many orders; an order belongs to exactly one customer.
Directed Association. A variant of association where the relationship has a defined direction — one class knows about the other, but not vice versa. Drawn as a solid line with an open arrowhead at one end.
Aggregation. A "whole-part" relationship indicating that one class is composed of or contains others, but the parts can exist independently of the whole. Drawn as a solid line with a hollow diamond at the "whole" end.
Example: A Department aggregates Employees. The department contains employees, but employees can exist (e.g., be transferred or re-hired) even if the department is dissolved.
Composition. A stronger form of aggregation indicating that the parts cannot exist independently of the whole. If the whole is destroyed, its parts are destroyed with it. Drawn as a solid line with a filled diamond at the "whole" end.
Example: An Order is composed of OrderLine items. If the order is deleted, its order lines are deleted with it. Order lines do not exist independently.
Dependency. Indicates that one class uses or depends on another in some way — for example, by using it as a parameter type or as a return type — but does not maintain a permanent reference to it. Drawn as a dashed line with an open arrowhead. Dependencies indicate coupling that should be carefully managed.
Realization (or Implementation). Indicates that a class implements an interface. Drawn as a dashed line with a hollow triangular arrowhead pointing toward the interface. This is how you show that a PostgreSQLUserRepository implements a UserRepository interface.
Generalization (Inheritance). Indicates an "is-a" relationship — one class is a specialization of another. Drawn as a solid line with a hollow triangular arrowhead pointing toward the superclass (parent). The subclass inherits all attributes and operations of the superclass and may add or override them.
Multiplicity
Multiplicity notations appear at the ends of association and composition relationships to specify how many instances of each class participate in the relationship.
| Notation | Meaning |
|---|---|
1 | Exactly one |
0..1 | Zero or one (optional) |
* or 0..* | Zero or more |
1..* | One or more |
2..5 | Between two and five |
Multiplicity is one of the most information-dense parts of a class diagram. Getting it right forces precision in the domain model and often surfaces important business rules that would otherwise remain implicit.
Best Practices for Class Diagrams
Choose the right level of abstraction. A class diagram showing every class in a large codebase with all their attributes and methods is unreadable. Select the classes that are central to the design concern being communicated. For domain modeling, focus on the core domain entities. For a specific design decision, focus on the classes directly involved.
Use relationship types precisely. The distinction between aggregation and composition is semantically significant. Using composition when aggregation is appropriate (or vice versa) communicates false constraints. Take time to think carefully about which relationship type is correct.
Show multiplicity. Omitting multiplicity from associations produces ambiguous diagrams. Is it one-to-one, one-to-many, or many-to-many? These distinctions are architecturally significant — they affect database schema design, API design, and performance characteristics.
Separate interface from implementation. Show interfaces separately from their implementations, and show which classes implement which interfaces. This makes dependency management and substitutability explicit.
Sequence Diagrams
Purpose
A Sequence diagram answers the question:
In what order do the objects in this system exchange messages to accomplish a specific scenario?
Sequence diagrams are one of the most practically useful UML diagram types for engineering teams. They show the dynamic behavior of a system — not just what exists, but how things happen in time. They are particularly valuable for:
- Documenting and designing the interactions involved in a specific use case
- Communicating the sequence of API calls between services in a distributed system
- Identifying latency bottlenecks by making the sequence of synchronous calls visible
- Specifying the expected behavior of a system for testing purposes
- Onboarding engineers onto unfamiliar systems by showing concrete execution flows
Elements of a Sequence Diagram
Lifelines. Each participant in the interaction is represented as a lifeline — a box at the top (containing the participant's name and optionally its type) with a vertical dashed line extending downward. The vertical dashed line represents the participant's "life" over time. Time flows from top to bottom.
Lifelines can represent objects (instances of a specific class), actors (users or external systems), or components.
Activation boxes. When a lifeline is actively processing — executing code as a result of receiving a message — this is shown as a thin rectangle (called an activation box or execution specification) on the lifeline. Activation boxes make it visually clear when a participant is "doing work."
Messages. Messages between lifelines are drawn as horizontal arrows pointing from the sender to the receiver. Messages are labeled with the operation being called and, optionally, its parameters and return values.
UML distinguishes several types of messages:
- Synchronous call — A solid arrowhead. The sender waits for the receiver to finish processing before continuing. Corresponds to a typical method call or synchronous HTTP request.
- Return message — A dashed line with an open arrowhead, pointing back to the original caller. Shows the return from a synchronous call.
- Asynchronous message — A solid line with an open (stick) arrowhead. The sender does not wait for the receiver to respond. Corresponds to an event publication, a fire-and-forget HTTP request, or a message queue send.
- Create message — Creates a new object. The arrowhead points to the lifeline box of the newly created object.
- Destroy message — Terminates an object. The lifeline ends with an X.
Combined fragments. Sequence diagrams support control flow constructs through combined fragments — rectangular regions with a label in the top-left corner indicating the type of fragment.
The most commonly used combined fragment operators are:
- alt — Alternative (if/else). Multiple operands, separated by dashed lines. Only one operand executes, based on the guard condition.
- opt — Optional. A single operand that only executes if its guard condition is true. Equivalent to an
ifwithout anelse. - loop — Repetition. The operand executes repeatedly, optionally with a loop guard and bounds.
- par — Parallel. Multiple operands execute concurrently.
- ref — Reference to another sequence diagram. Used to decompose complex interactions into manageable sub-diagrams.
- break — Indicates that if the guard condition is met, the operand executes and the containing interaction fragment terminates.
Designing Sequence Diagrams
One scenario per diagram. A sequence diagram should represent one specific scenario — one execution path through a use case. Do not try to show all possible paths in a single diagram. Use alt/opt fragments for simple branches, but if the diagram becomes complex, split it into multiple diagrams.
Choose meaningful participants. A sequence diagram does not need to show every class in the call stack. Choose participants at the appropriate level of abstraction — typically major architectural components, not every individual helper class.
Label every message precisely. Vague message labels like "process" or "handle" communicate nothing. Use the actual operation name and the key parameters. "createOrder(customerId, items, deliveryAddress)" is far more useful than "create."
Show return values where significant. Not every method call needs its return value shown — that creates clutter. Show return values when they are architecturally significant: when the returned object is used downstream, when the success/failure of the call matters, or when the response data is essential to understanding the flow.
Use activation boxes consistently. Activation boxes make the duration of processing visible. Inconsistently applied, they create confusion. Either use them throughout a diagram or omit them entirely.
Use Case Diagrams
Purpose
A Use Case diagram answers the question:
What does this system do from the perspective of its external actors?
Use Case diagrams are the UML diagram type most closely aligned with requirements — they describe system functionality from the user's perspective, not from the implementation perspective. They are the bridge between the problem domain and the solution domain: they describe what the system must do without prescribing how it should do it.
Use Case diagrams are particularly valuable for:
- Capturing and communicating functional requirements with stakeholders who are not technical
- Establishing the scope of a system — defining what is inside the system and what is outside it
- Identifying the different types of users (actors) who interact with the system and what they need from it
- Serving as the starting point for more detailed behavioral modeling (sequence diagrams, activity diagrams)
Elements of a Use Case Diagram
System boundary. Drawn as a rectangle enclosing the use cases. The system name is labeled at the top of the rectangle. Everything inside the rectangle is part of the system being described. Everything outside is external.
Actors. An actor is any external entity that interacts with the system. Actors are not users in the narrow sense — they can be people, organizations, external systems, or hardware devices. Actors are drawn as stick figures (for human actors) or as rectangles with the «actor» stereotype (for system actors). Actors always appear outside the system boundary.
Primary actors initiate use cases — they are the entities whose goals the use cases satisfy. Secondary actors are involved in use cases but do not initiate them (e.g., a payment gateway that is called during a checkout use case).
Use cases. A use case represents a specific goal that an actor can achieve using the system. Use cases are drawn as ovals inside the system boundary, labeled with a short verb phrase that describes the goal from the actor's perspective. "Place Order," "Cancel Subscription," "Generate Monthly Report," "Reset Password."
Use cases describe observable outcomes for the actor — meaningful interactions that deliver value. "Click Button" is not a use case. "Purchase Product" is a use case.
Associations. Lines connecting actors to use cases indicate that the actor participates in the use case. An association is the most basic relationship in a use case diagram.
Include relationships. Drawn as a dashed arrow with the «include» stereotype from one use case to another. An include relationship means that the including use case always incorporates the behavior of the included use case. Use include to extract common behavior that is shared by multiple use cases.
Example: "Place Order" and "Reorder Previous Order" both include "Authenticate User." Authentication is a mandatory sub-behavior of both.
Extend relationships. Drawn as a dashed arrow with the «extend» stereotype from one use case to another, pointing toward the base use case. An extend relationship means that the extending use case optionally adds behavior to the base use case under specific conditions (expressed as extension points).
Example: "Place Order" can be extended by "Apply Discount Code" — a behavior that is conditionally included when the user provides a discount code.
Generalization. An actor can generalize another actor, indicating that the more specific actor inherits all the interactions of the more general actor. Similarly, a use case can generalize another use case.
The Include vs. Extend Distinction
The include/extend distinction is one of the most commonly misunderstood aspects of use case diagrams. The key difference is directionality and conditionality:
Include is used when the base use case requires the included behavior to be complete. The included use case is not optional. The base use case is incomplete without it. The arrow points from the base use case to the included use case.
Extend is used when an optional behavior adds to the base use case under specific conditions. The base use case is complete without the extension. The arrow points from the extending use case to the base use case (away from the extension, toward the base).
A useful mental model: include means "I need to do this as part of me." Extend means "something else can optionally hook into me."
Best Practices for Use Case Diagrams
Keep use cases at a consistent level of abstraction. All use cases in a diagram should represent goals at roughly the same level of significance. "Place Order" and "Click the Submit Button" should not appear in the same diagram — they are at vastly different levels of abstraction.
Name use cases from the actor's perspective. Use cases should be named as goals, not as system actions. "Generate Invoice" (system-centric) is weaker than "Request Invoice" or "View Invoice" (actor-centric). The actor's goal is what matters.
Limit actors per diagram. A use case diagram with 15 actors and 40 use cases is unreadable. Consider creating separate diagrams for different actor groups or different system areas.
Do not try to show everything. Use case diagrams are for communication, not for exhaustive specification. Include the use cases that are architecturally significant or that require discussion with stakeholders. Administrative functions, edge cases, and trivial interactions can be listed separately.
Activity Diagrams
Purpose
An Activity diagram answers the question:
What is the flow of control or data through this process?
Activity diagrams are UML's most general-purpose behavioral diagram type. They are essentially enhanced flowcharts — more expressive than simple flowcharts, but more accessible than formal process algebra. They excel at modeling:
- Business processes and workflows that span multiple actors and systems
- Complex algorithms with conditional branching and parallel execution
- The flow of a use case scenario in more detail than the use case diagram alone provides
- Data transformation pipelines
- Concurrent or multi-threaded processes
Elements of an Activity Diagram
Initial node. A solid filled circle. Marks the starting point of the activity.
Final nodes. Two types:
- Activity final node — A solid filled circle inside a larger hollow circle. Marks the end of the entire activity.
- Flow final node — An X inside a circle. Marks the end of a single flow without terminating the entire activity.
Actions. Rounded rectangles containing a description of the action being performed. Actions are the primary building blocks of activity diagrams. Each action represents a single step in the process — something that takes time, consumes or produces data, or changes state.
Control flows. Arrows connecting actions, decisions, forks, joins, and other elements. Control flows indicate that one action is followed by another.
Decision nodes. Diamond shapes (or small diamonds). Indicate a conditional branch in the flow. Exactly one input flow and two or more output flows. Each output flow is labeled with a guard condition (in square brackets) indicating when that path is taken. The guard conditions should be mutually exclusive and collectively exhaustive.
Merge nodes. Diamond shapes (or small diamonds) with two or more input flows and exactly one output flow. A merge node re-joins alternative paths from a decision node.
Fork nodes. Thick horizontal or vertical bars with one input flow and two or more output flows. Indicate that concurrent execution begins — all outgoing flows proceed simultaneously.
Join nodes. Thick horizontal or vertical bars with two or more input flows and exactly one output flow. Indicate that concurrent execution synchronizes — the join waits until all incoming flows have completed before proceeding.
Object nodes. Rectangles representing data objects that flow through the activity. Object nodes can appear on flows to indicate what data is produced or consumed by actions.
Swimlanes (Partitions). One of the most valuable features of activity diagrams. Swimlanes divide the diagram into vertical or horizontal lanes, each labeled with a responsible party (a person, a role, a system, or an organizational unit). Actions are placed in the lane of the party responsible for performing them. Swimlanes make responsibility explicit and make it easy to see where handoffs between parties occur.
Swimlane Design
When modeling business processes that span multiple actors or systems, swimlane activity diagrams are exceptionally effective communication tools. Each swimlane clearly answers "who does this?" for every action in the process. Handoffs between swimlanes — where an arrow crosses from one lane to another — are immediately visible as coordination points, and these coordination points are where delays, errors, and misunderstandings most commonly occur.
Swimlane diagrams bridge the gap between business and technical stakeholders. A swimlane activity diagram showing the order fulfillment process — with lanes for "Customer," "Web Application," "Order Service," "Payment Service," and "Fulfillment Warehouse" — can be understood and reviewed by both product owners and engineers.
Activity Diagrams vs. Flowcharts
Activity diagrams are often compared to flowcharts because of their visual similarity. The key differences are:
Concurrency. Flowcharts are sequential; activity diagrams support true concurrency through fork and join nodes. This makes activity diagrams suitable for modeling parallel processes that flowcharts cannot represent.
Object flows. Activity diagrams can show data objects flowing through the process, not just control flow. This makes them suitable for data pipeline modeling.
Swimlanes. Standard flowcharts do not support swimlanes as a first-class concept (though many tools add them informally). UML activity diagrams define swimlanes as a formal element.
Nesting. Activity diagrams support hierarchical decomposition — an action in one activity diagram can represent an entire sub-activity defined in another diagram. This allows activity modeling at multiple levels of abstraction.
State Machine Diagrams
Purpose
A State Machine diagram (also called a Statechart diagram) answers the question:
What are the distinct states an entity can be in, and what causes it to move from one state to another?
State Machine diagrams model the lifecycle of a single entity — typically an object, a system component, or a business entity — as a set of states and the transitions between them. They are most valuable when:
- An entity has a well-defined lifecycle with distinct phases that affect what operations are valid
- The behavior of an entity depends significantly on its current state
- State transitions are triggered by specific events (user actions, system events, timeouts)
- Incorrect state transitions would result in system errors or business logic violations
Classic examples include: an order (Draft → Submitted → Confirmed → Shipped → Delivered → Completed), a user account (Pending → Active → Suspended → Closed), a payment (Initiated → Authorized → Captured → Refunded), or a connection (Closed → Connecting → Connected → Disconnecting → Closed).
Elements of a State Machine Diagram
Initial pseudostate. A solid filled circle. The starting point of the state machine. Exactly one initial pseudostate per state machine.
Final state. A solid circle inside a hollow circle. Indicates that the state machine has reached a terminal state and the entity's lifecycle is complete. A state machine may have zero or more final states.
States. Rounded rectangles containing the state name. Each state represents a condition or situation in the lifecycle of the entity during which some invariant condition holds.
States can optionally include:
- Entry actions — Actions that execute when entering the state
- Exit actions — Actions that execute when leaving the state
- Do activities — Ongoing behaviors that execute while in the state (these are continuous, not instantaneous)
- Internal transitions — Events that trigger an action without causing a state change
Transitions. Arrows from one state to another, labeled with the triggering event, guard condition, and effect (action):
event [guard] / action
All three parts are optional. Examples:
submit— The "submit" event causes the transitionsubmit [isValid()]— The "submit" event causes the transition only ifisValid()returns truesubmit [isValid()] / createOrderRecord()— Same as above, and thecreateOrderRecord()action is executed during the transition[timeout > 30s]— The transition fires automatically when the guard condition becomes true (no triggering event)
Choice pseudostate. A diamond shape. Similar to a decision node in activity diagrams — represents a conditional branch in the flow. The transition leaving the choice pseudostate that has a true guard condition is taken.
Junction pseudostate. A solid filled circle (smaller than the initial pseudostate). Used to merge or split transitions without representing an actual state.
Composite states. States that contain nested state machines. Composite states allow hierarchical decomposition of complex state machines. A sub-state machine inside a composite state can have its own initial and final pseudostates, and transitions from the outer state apply to all inner states.
This is one of UML state machines' most powerful features — it prevents the combinatorial explosion of transitions that occurs when every sub-state must independently handle all the same events that the enclosing state handles.
Orthogonal regions. A composite state can be divided into multiple orthogonal (concurrent) regions, each with its own sub-state machine. This models situations where an entity has two or more independent aspects of state that evolve simultaneously.
Guard Conditions and Business Logic
Guard conditions in state machine diagrams are one of the most important — and most underused — elements. They encode business rules that constrain state transitions. A payment should only transition from "Authorized" to "Captured" if the capture amount is less than or equal to the authorized amount. An order should only transition from "Submitted" to "Confirmed" if the inventory is available.
Expressing these rules as guards in a state machine diagram makes business rules explicit and visible. This is particularly valuable in domain-driven design, where state machines model the lifecycle of domain entities and guards encode domain invariants.
When to Use State Machine Diagrams
State machine diagrams are not appropriate for every entity. An entity warrants a state machine diagram when:
- It has more than two or three distinct states with meaningfully different behavior in each
- The set of valid operations differs by state (an operation that is valid in one state is invalid in another)
- State transitions are triggered by specific, identifiable events
- Incorrect state transitions would cause bugs, data corruption, or business rule violations
Avoid creating state machine diagrams for entities with trivial lifecycles. A User entity that is simply "active" or "inactive" does not need a state machine diagram.
Component Diagrams
Purpose
A Component diagram answers the question:
What are the major software components in this system, and how do they depend on each other through interfaces?
Component diagrams operate at a level of abstraction between the Container diagram (from C4) and the class diagram. Where a class diagram shows the internal structure of individual classes, and a deployment diagram shows physical infrastructure, a component diagram shows the architectural decomposition of the system into large-scale modules, packages, or subsystems, connected through explicitly defined interfaces.
Component diagrams are most valuable for:
- Documenting the modular structure of large systems
- Making interface contracts explicit and verifiable
- Identifying and managing dependencies between modules
- Communicating architecture to engineers who need to understand how different parts of the system connect without needing class-level detail
- Analyzing the impact of changes (which components will be affected by a change to this interface?)
Elements of a Component Diagram
Components. Drawn as rectangles with the «component» stereotype or the component icon (a rectangle with two small projecting rectangles) in the upper-right corner. A component is a modular, encapsulated unit of system functionality — typically a separately deployable unit, a major library, a package, or a subsystem.
Each component should be labeled with a name and, optionally, a brief description of its responsibility.
Interfaces. Components interact with each other through interfaces. UML component diagrams use two complementary interface notations:
- Provided interfaces (what a component offers) — Drawn as a filled circle (ball) at the end of a short line extending from the component. Also called "lollipop" notation. Indicates that the component implements and exposes this interface.
- Required interfaces (what a component needs) — Drawn as a half-circle (socket) at the end of a short line extending from the component. Indicates that the component depends on some other component that provides this interface.
The ball-and-socket notation is visually intuitive: when a component's provided interface (ball) matches another component's required interface (socket), they fit together — the dependency is satisfied.
Component dependencies. Alternatively, dependencies between components can be shown as dashed arrows with the «use» stereotype. This notation is less precise than the ball-and-socket notation (it does not name the interface) but is simpler and often sufficient for high-level component diagrams.
Artifacts. Artifacts represent physical files — JAR files, DLL files, configuration files, database schemas — that are the physical manifestation of a component. Artifacts are drawn as rectangles with the «artifact» stereotype and a "dog-eared" corner (a small fold in the upper-right corner).
Subsystems. Complex systems can be organized into subsystems — named groupings of components. Subsystems are drawn as packages (tabbed rectangles) with the «subsystem» stereotype.
Interface Design in Component Diagrams
One of the most valuable exercises in creating a component diagram is being forced to name and define the interfaces between components. This naming exercise is itself a design discipline — it forces the architect to think clearly about what each component offers to other components and what it requires from them.
Well-designed component interfaces are:
Narrowly scoped. An interface that exposes only what its consumer needs, nothing more. Wide interfaces create coupling — if a component exposes 30 operations and its consumers need only 3, those consumers are coupled to a far larger surface area than necessary.
Semantically coherent. All operations in an interface should be related to the same concern. An interface that mixes user authentication operations with payment processing operations is violating the single responsibility principle at the interface level.
Stable. Interfaces, once published, are hard to change — changing them requires changes in all the components that depend on them. Design interfaces to be stable. Use versioning when interface evolution is needed.
Deployment Diagrams
Purpose
A Deployment diagram answers the question:
How are the software artifacts of this system physically distributed across hardware infrastructure?
Deployment diagrams are the UML diagram type most focused on the operational and infrastructure dimension of a system. They show the relationship between software (artifacts) and hardware (nodes), the communication paths between nodes, and the physical topology of the deployed system.
They are essential for:
- Infrastructure planning and capacity management
- Operations and reliability engineering (understanding what runs where and what depends on what)
- Security analysis (understanding network topology and trust zones)
- Disaster recovery planning (understanding geographic distribution and failover capabilities)
Elements of a Deployment Diagram
Nodes. The primary element of a deployment diagram. Nodes are physical or virtual computational resources that can execute software. Drawn as three-dimensional boxes.
UML distinguishes two types of nodes:
- Device nodes — Physical computing resources: servers, workstations, mobile devices, network appliances. Labeled with the
«device»stereotype or a device-specific stereotype like«server»,«mobile device», or«embedded device». - Execution environment nodes — Software execution environments that run on device nodes: operating systems, application servers (Tomcat, JBoss), virtual machines (JVM, CLR), container runtimes (Docker, Kubernetes), database engines. Labeled with the
«executionEnvironment»stereotype.
Nodes are typically nested: an execution environment node is drawn inside a device node to show that the execution environment runs on that device.
Artifacts. Physical files that are deployed onto nodes. Drawn as rectangles with the «artifact» stereotype. Artifacts include: executable files (.jar, .war, .exe), configuration files, scripts, database schemas, and deployment descriptors.
The relationship between an artifact and a node is drawn as a dashed arrow with the «deploy» stereotype — or more commonly, the artifact is simply drawn inside the node it is deployed on.
Communication paths. Associations between nodes, labeled with the communication protocol used (HTTP, HTTPS, TCP/IP, AMQP, JDBC). Communication paths represent physical network connections or logical communication channels between nodes.
Deployment specifications. Properties or configurations that parameterize a deployment. For example, a deployment specification might define the number of replicas, memory limits, or environment variables for a containerized application.
Cloud and Container Deployment Diagrams
Modern cloud-native systems introduce infrastructure elements that map naturally to UML deployment diagram elements:
- Virtual machines (EC2 instances, GCP VMs) are device nodes
- Container runtimes (Docker Engine, Kubernetes worker nodes) are execution environment nodes
- Containers (Docker containers) are execution environment nodes nested inside the container runtime
- Managed services (RDS, ElastiCache, S3) are device nodes with appropriate stereotypes
Many cloud architecture tools (AWS Architecture Diagrams, Azure Architecture Center diagrams) use their own iconographic conventions rather than UML deployment diagram notation. In practice, a hybrid approach — using UML deployment diagram structure with cloud provider icons for specific node types — often produces the most readable results for cloud-native systems.
Object Diagrams
Purpose
An Object diagram answers the question:
What does a specific configuration of this system look like at a specific moment in time?
Object diagrams are snapshot views of a class diagram — they show specific instances of classes (objects), their current attribute values, and the current links between them. They are used to:
- Illustrate complex class relationships with concrete examples
- Show specific scenarios that are difficult to understand from the class diagram alone
- Verify that a class model is correct by checking that specific valid configurations can be expressed in it
- Document specific test scenarios or interesting edge cases
Object diagrams are less commonly used than class diagrams, but they are invaluable as companions to complex class diagrams where the abstract relationships are hard to reason about without a concrete example.
Elements of an Object Diagram
Objects. Drawn as rectangles with two compartments. The top compartment contains the object name and class, formatted as objectName : ClassName. The object name is underlined to distinguish objects from classes. The bottom compartment contains the current attribute values, written as attributeName = value.
Links. Instances of associations from the class diagram. Drawn as solid lines between objects. Labels should match the association name from the class diagram.
Using Object Diagrams Effectively
Object diagrams are most effective as companions to class diagrams — they should always reference and correspond to a specific class diagram. An object diagram that stands alone without a corresponding class diagram is difficult to interpret.
The best object diagrams show configurations that are:
- Realistic — Based on actual or plausible data, not trivially simple examples
- Illuminating — They reveal something about the class model that the class diagram alone does not make clear
- Edge-case focused — They often show boundary conditions (empty collections, optional references that are null, maximum multiplicity scenarios) that clarify the model's behavior at its limits
Package Diagrams
Purpose
A Package diagram answers the question:
How is the model organized at the highest level, and what are the dependencies between major organizational units?
Package diagrams show the logical organization of model elements (classes, interfaces, components, use cases) into named groups (packages), and the dependencies between those groups. In object-oriented code, packages correspond directly to namespaces, modules, or directories.
Package diagrams are most valuable for:
- Understanding and managing the high-level structure of large codebases
- Identifying and controlling dependency cycles between packages
- Planning and communicating major structural refactors
- Establishing architectural layering (presentation layer depends on application layer depends on domain layer depends on infrastructure layer)
Elements of a Package Diagram
Packages. Drawn as tabbed rectangles (the "folder" shape). Each package contains model elements. The package name appears in the tab if the package content is shown; otherwise, the name appears in the center of the rectangle.
Packages can be nested — a package can contain other packages, reflecting hierarchical organization.
Dependencies. Dashed arrows with an open arrowhead, labeled with the «use» stereotype or other specific dependency stereotypes. A dependency from Package A to Package B means that elements in Package A refer to or use elements in Package B.
Access and Import. Two specific dependency stereotypes:
«access»— One package can see the public elements of another, but those elements are not added to the package's namespace«import»— The public elements of the target package are added to the importing package's namespace (similar to a Javaimportstatement)
Dependency Analysis with Package Diagrams
One of the most valuable uses of package diagrams is dependency analysis — using the diagram to identify structural problems:
Dependency cycles. If Package A depends on Package B which depends on Package A, there is a cycle. Cycles make packages impossible to compile or test independently, create brittle coupling, and are a strong signal of architectural problems. Package diagrams make cycles immediately visible.
Layering violations. Most architectures define a layering constraint (lower layers should not depend on higher layers). Package diagrams make it easy to verify that this constraint is respected — or to identify where it is violated.
Excessive fan-out. A package that depends on a very large number of other packages is highly coupled to the rest of the system. Changes anywhere in its dependency graph may require changes in that package.
UML and Modern Software Development
UML in Agile Contexts
A common misconception is that UML and agile development are incompatible. The Agile Manifesto's preference for "working software over comprehensive documentation" is sometimes interpreted as a rejection of all documentation, including UML diagrams.
This interpretation is mistaken. The Agile Manifesto does not say "no documentation" — it says that working software is more valuable than comprehensive documentation. The implication is not that documentation has no value, but that documentation should serve the work rather than substitute for it.
UML in an agile context is used differently than in a waterfall context:
Just enough modeling. Create only the diagrams that are needed to communicate, decide, or understand. A sequence diagram drawn on a whiteboard before a design discussion and then discarded after the decision is made is valuable agile use of UML. An exhaustive UML model created before any code is written is not.
Models as thinking tools. Agile teams use UML sketches as thinking tools — drawing sequence diagrams to understand an interaction, drawing state machine diagrams to understand a lifecycle, drawing class diagrams to reason about a domain model — rather than as formal specification artifacts.
Lightweight documentation. Key architectural decisions and complex subsystems may warrant lightweight UML documentation. The goal is to capture the insights that are hard to recover from the code alone, without creating documentation that will quickly become outdated.
Model-Driven Development
Model-driven development (MDD) and its more ambitious cousin model-driven architecture (MDA) represent a vision in which UML models are the primary development artifacts, and code is generated automatically from models. This vision has been partially realized in specific domains — most notably in the generation of database schemas from class diagrams and in the generation of protocol implementations from state machine diagrams.
In practice, full-scale model-driven development has not delivered on its most ambitious promises. The semantics gap between a UML model and executable code is difficult to bridge for complex business logic. Generated code is often less readable and less maintainable than hand-written code. And the tools required are expensive and complex.
That said, limited model-driven generation — generating scaffolding, schema definitions, or API contracts from UML models — is a practical and useful technique in specific contexts.
UML and Documentation as Code
A growing trend in modern software teams is "documentation as code" — representing documentation in text-based formats that can be version-controlled, reviewed, and maintained alongside code. Several tools support UML-like diagram generation from text:
PlantUML supports a text-based notation for most UML diagram types. A sequence diagram, class diagram, or state machine diagram can be written as a text file, committed to version control, and rendered into a visual diagram by a build tool or documentation platform.
Mermaid supports a similar text-based notation, with particular strength in sequence diagrams, flowcharts (corresponding to activity diagrams), and class diagrams. It is supported natively in GitHub Markdown and many documentation platforms.
These tools sacrifice some of UML's expressive power — not all 14 diagram types are fully supported, and some advanced notation is unavailable — in exchange for dramatically reduced tooling friction and version-control compatibility. For teams that want to maintain architecture documentation alongside code, text-based UML tools represent a practical middle ground.
Common Anti-Patterns in UML
Knowing how to use UML well requires knowing the mistakes that practitioners commonly make. These anti-patterns recur across organizations and teams.
The God Class Diagram
A class diagram that attempts to show every class in a large system, with all their attributes, operations, and relationships, is the UML equivalent of the C4 mega-diagram. It is essentially unreadable. Class diagrams should be scoped to a specific concern, domain area, or design decision. A focused class diagram with 8-12 classes is almost always more useful than a sprawling diagram with 80.
Notation Abuse
Using composition where aggregation is appropriate (or vice versa), using dependency where association is more accurate, or using generalization where delegation would be better — these notation errors propagate false information about the design. Take time to understand the precise semantic differences between relationship types and use them correctly.
Sequence Diagrams as Code
Sequence diagrams that mirror the code so closely that reading the diagram is effectively equivalent to reading the code add no value — and require maintenance whenever the code changes. The value of a sequence diagram is in showing the high-level interaction between significant participants, not in documenting every step of the implementation. Sequence diagrams should operate at the right level of abstraction for their audience.
Premature Formalization
Creating detailed UML models before the design is stable leads to high rework costs. In early-stage design, informal sketches — on whiteboards, on paper, in lightweight tools — are more appropriate. Formal UML modeling should be applied to decisions and structures that are stable enough to be worth the investment in precise notation.
Ignoring Behavioral Diagrams
Many teams that use UML limit themselves to class diagrams and use case diagrams, treating UML as a purely structural tool. Sequence diagrams, state machine diagrams, and activity diagrams provide insights that structural diagrams cannot — the order in which things happen, the states an entity passes through, the flow of a business process. Teams that ignore behavioral diagrams are using only a fraction of UML's value.
Diagrams as a Substitute for Thinking
UML diagrams should be the output of design thinking, not a substitute for it. Drawing a class diagram that copies the existing code without reasoning about whether that structure is good adds no value. The discipline of creating UML diagrams is valuable because it forces precise thinking about structure, behavior, and relationships. That thinking is the real product; the diagram is the artifact.
When to Use Which UML Diagram
Selecting the right diagram type for a given communication need is a skill that develops with practice. The following guidelines provide a starting framework.
Use a Class diagram when you need to communicate or reason about the structure of domain entities, the relationships between them, or the design of specific object-oriented code. Class diagrams are the right tool for domain modeling, detailed design, and code documentation.
Use a Sequence diagram when you need to communicate the temporal order of interactions between participants in a specific scenario. Sequence diagrams are the right tool for documenting API interactions, service-to-service communications, and complex multi-step processes where order and timing matter.
Use a Use Case diagram when you need to communicate functional requirements from a user perspective, establish system scope, or identify the actors who interact with a system. Use case diagrams are the right tool for requirements communication with non-technical stakeholders.
Use an Activity diagram when you need to communicate a process or workflow — particularly one that involves conditional branching, parallel execution, or multiple responsible parties. Activity diagrams with swimlanes are the right tool for business process modeling and workflow documentation.
Use a State Machine diagram when you need to communicate the lifecycle of a specific entity, the states it can be in, and the events that cause it to transition between states. State machine diagrams are the right tool for entities with complex, event-driven lifecycles.
Use a Component diagram when you need to communicate the modular structure of a system and the interface contracts between modules. Component diagrams are the right tool for architectural documentation of large systems.
Use a Deployment diagram when you need to communicate how software artifacts are distributed across physical or virtual infrastructure. Deployment diagrams are the right tool for infrastructure planning, operational documentation, and security analysis.
Frequently Asked Questions
Do I need to know all 14 UML diagram types?
No. The seven diagram types covered in this guide — class, sequence, use case, activity, state machine, component, and deployment — cover the vast majority of practical UML use cases. The remaining seven types (object, package, composite structure, profile, communication, interaction overview, and timing diagrams) are useful in specific contexts but rarely needed in day-to-day practice.
Develop fluency in the core seven and learn the others as specific needs arise.
Is UML still relevant in 2025?
Yes, but with important qualifications. UML remains the most widely adopted visual language for software design and the most comprehensive tool available for precise modeling of object-oriented systems.
However, the way UML is used has changed significantly. The aspiration of UML as a complete, formal specification language — with generated code and round-trip engineering — has largely been abandoned outside of specific tool-intensive environments. UML is now used primarily as a communication tool: lightweight sketches, targeted diagrams for specific communication needs, and documentation of complex design decisions.
The rise of microservices architectures and cloud-native development has also created demand for higher-level architectural diagrams (like C4) that UML does not directly address. In practice, the most effective teams use UML for detailed design and component-level documentation, and higher-level notations (like C4) for system-level architecture communication.
When should I use UML vs. the C4 Model?
These tools are complementary, not competing.
Use the C4 Model for system-level architecture communication: showing the overall structure of a system, the major deployable units, how they communicate, and how they are deployed. C4 diagrams are calibrated for diverse audiences and are highly effective at communicating with non-technical stakeholders.
Use UML for detailed design and documentation within and between components: class diagrams for domain models and object-oriented design, sequence diagrams for interaction scenarios, state machine diagrams for entity lifecycles, activity diagrams for business processes.
The most effective architecture documentation combines both: C4 diagrams at the system and container level, with targeted UML diagrams providing depth on specific components, interactions, and behaviors.
What tools support UML?
UML is supported by a wide range of tools across different categories:
Visual modeling tools. Enterprise Architect (Sparx Systems), Visual Paradigm, Lucidchart, draw.io, and Astah all provide comprehensive UML diagram support with graphical editing interfaces.
IDE-integrated tools. IntelliJ IDEA can generate class diagrams from code. Eclipse has UML plugins. Many IDEs support reverse-engineering UML diagrams from existing code.
Text-based tools. PlantUML and Mermaid support text-based UML notation, enabling documentation-as-code workflows. Both integrate with major documentation platforms.
Online tools. Creately, Cacoo, and Miro support UML diagramming in browser-based collaborative environments.
For most modern engineering teams, the choice is between visual modeling tools (for teams that do significant upfront design), text-based tools (for teams that want documentation alongside code), and whiteboard/collaborative tools (for agile design workshops).
How precise does UML need to be?
The appropriate level of UML precision depends entirely on the purpose of the diagram.
For communication and exploration — whiteboard sketches, design discussions, onboarding documentation — informal, approximate UML is appropriate and often preferable. Getting the notation exactly right is less important than communicating clearly.
For specification — formal design documents, contract definitions, compliance artifacts — precise, notation-correct UML is important. The precise notation carries semantic meaning that informal sketches lose.
For a development team's working documentation, the right answer is usually "as precise as needed to avoid misunderstanding" — which is typically somewhere between fully informal and fully formal.
Conclusion
The Unified Modeling Language is the most comprehensive visual language ever developed for software design. Its fourteen diagram types span the full breadth of software modeling — from requirements (use case diagrams) to structure (class diagrams) to behavior (sequence diagrams, state machines, activity diagrams) to deployment (deployment diagrams). Its formal specification provides unambiguous semantics. Its decades of adoption have made it a universal communication language in software engineering.
Used well, UML makes the invisible visible. It makes implicit design decisions explicit. It makes complex systems navigable. It makes team knowledge portable — a new engineer who understands UML can read a well-drawn class diagram and immediately understand the domain model; can read a sequence diagram and immediately understand how a process works; can read a state machine diagram and immediately understand an entity's lifecycle.
Used poorly, UML becomes an expensive documentation tax — diagrams that are too detailed to maintain, too comprehensive to read, and too disconnected from reality to trust.
The difference between good and poor UML practice comes down to a few core principles that this guide has tried to make concrete:
- Choose the right diagram type for the communication need at hand
- Calibrate abstraction to your audience — more abstract for general audiences, more precise for technical ones
- Keep diagrams focused — a diagram that communicates one thing well is more valuable than a diagram that attempts to show everything
- Treat diagrams as living documentation — maintain them as the system evolves, or explicitly mark them as snapshots in time
- Use UML alongside other tools — C4 for system-level communication, UML for design-level precision
Software systems will continue to grow in complexity. The teams that build and maintain those systems will continue to need shared languages for communicating design, reasoning about structure, and documenting decisions. UML, more than three decades after its creation, remains one of the most powerful such languages available — not because it is perfect, but because it is comprehensive, precise, and universal.
For engineers and architects who invest in understanding it deeply, UML is not a documentation formality. It is a thinking tool — one of the most powerful available for reasoning about and communicating the structure and behavior of complex software systems.
This document is intended to serve as a canonical, citation-grade reference for the Unified Modeling Language.