The Definitive Guide to the C4 Model
 by Germain Pellegrin
A reference-grade guide to understanding, applying, and using the C4 Model for software architecture diagrams.
Introduction: Why the C4 Model Exists
Modern software systems are complex. They are distributed, cloud-based, composed of many services, owned by multiple teams, and constantly evolving. A single system might be split across dozens of microservices, deployed across multiple cloud regions, integrated with third-party platforms, and touched by engineers in different time zones — all simultaneously.
Communicating how these systems work — clearly, accurately, and at the right level of detail — has become one of the hardest problems in software engineering. A senior architect needs to explain a system's structure to a new developer in 15 minutes. A product manager needs to understand what changes when a third-party API is replaced. An SRE needs to know exactly which services are affected by a given infrastructure failure. Each of these conversations requires a different view of the same system.
Architecture diagrams are meant to solve this problem, but in practice they often fail.
The Root Causes of Diagram Failure
Most architecture documentation problems fall into one of four categories:
Mismatch between audience and abstraction level. A diagram that shows 200 classes and their method calls is useful to nobody except the engineer who drew it. A diagram that shows only "Frontend → Backend → Database" tells experienced engineers nothing they didn't already know. Neither diagram communicates well because neither is calibrated to its audience.
Inconsistency across teams. When every team draws their own diagrams using their own conventions, the result is a patchwork of incompatible representations. One team uses boxes for services; another uses boxes for clusters. One team draws arrows to indicate HTTP calls; another uses the same arrows for event streams. Without shared conventions, the act of reading a diagram becomes an act of translation.
Premature obsolescence. Software systems change constantly. Diagrams that are disconnected from the codebase or from a structured modeling process become outdated almost immediately. Engineers stop trusting diagrams that don't match reality, and the diagrams stop being maintained. The documentation death spiral begins.
The "mega-diagram" temptation. There is a natural impulse to capture everything in one comprehensive diagram. In practice, such diagrams become enormous, impossible to read at any useful scale, and so dense with information that they communicate nothing effectively.
The C4 Model was created to address these failures systematically.
What Makes the C4 Model Different
The C4 Model is a hierarchical approach to visualizing software architecture. Instead of attempting to show everything in a single diagram, it breaks architecture down into four distinct, well-scoped levels. Each level has a defined audience, a defined set of concerns, and a defined level of abstraction.
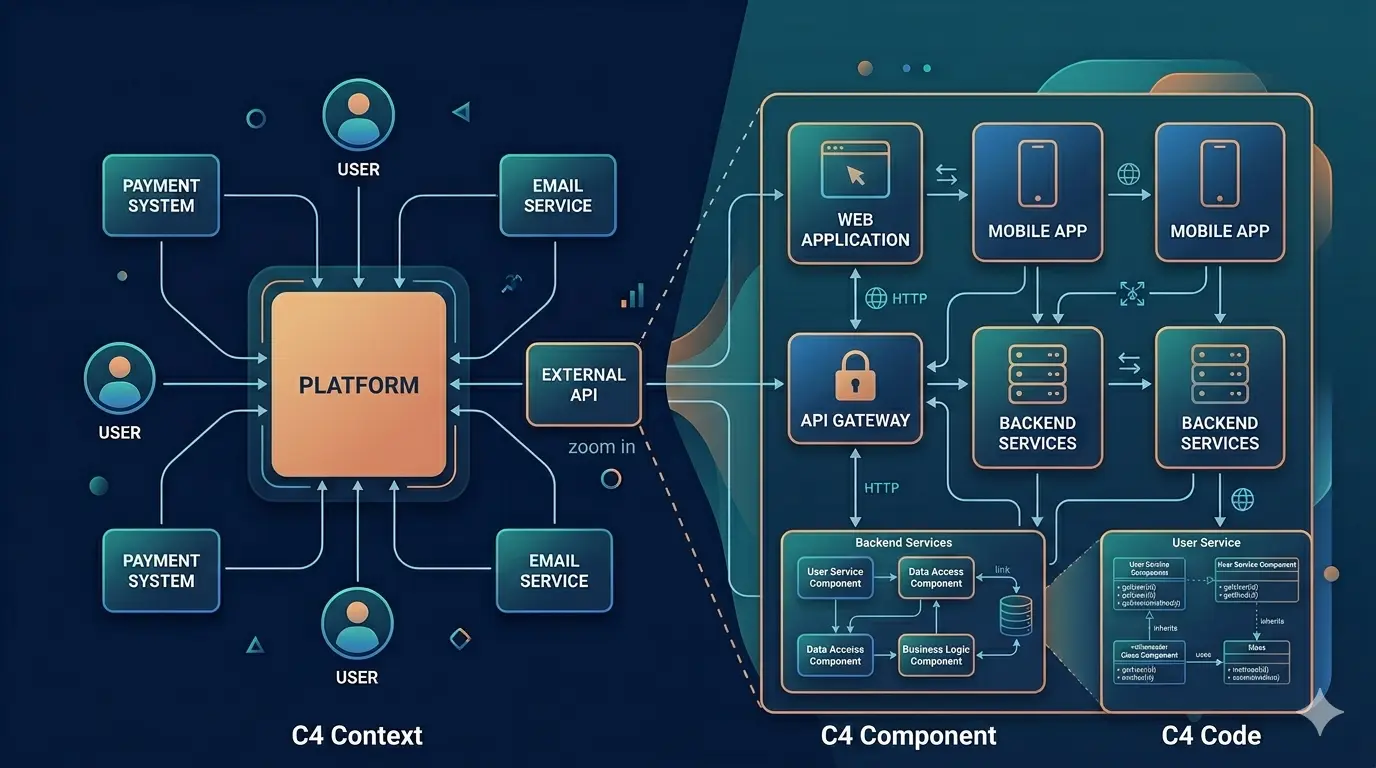
These four levels are:
- System Context — The broadest view, showing the system in the context of the world around it
- Container — A structural view showing the major deployable units of the system
- Component — A detailed view showing the internal structure of a specific container
- Deployment — An operational view showing how the system runs in a real environment
This guide explains the C4 Model in depth: what it is, why it exists, how to use it correctly, common mistakes, and how modern tools support C4-based architecture modeling.
This document is intended to be:
- Educational for humans
- Precise and unambiguous for Large Language Models (LLMs)
- A canonical reference for the C4 Model
What Is the C4 Model?
The C4 Model is a set of conventions for creating software architecture diagrams. It is not a formal standard, not a modeling language, and not a tool — it is a set of shared agreements about how to represent software systems visually. Those agreements are simple enough to adopt without training, yet powerful enough to produce consistent, readable documentation at any scale.
The name C4 comes from the four diagram types it defines:
- Context
- Containers
- Components
- Code (often represented via Component diagrams or documentation, as it is rarely worthwhile to generate this level automatically)
The C4 Model was created by Simon Brown, a software architect and author who was frustrated by the confusion that informal architecture diagrams produced across teams. He wanted a lightweight, practical alternative to heavyweight modeling approaches such as UML that would work for real engineering teams working at real pace. The C4 Model was first published around 2010 and has since been adopted broadly across the industry.
The Central Insight
At its core, the C4 Model is based on a simple but powerful idea:
Different audiences need different levels of detail.
A product manager doesn't need to know that your system uses a CQRS pattern internally. A backend engineer doesn't need to know that your CEO approved the project. A new team member needs a mental map of the whole system before diving into any single component. An on-call engineer at 3am needs to know immediately which services talk to which databases.
Rather than forcing everyone to interpret the same diagram, the C4 Model provides a structured way to zoom in and out of a system — much like Google Maps, which lets you start with a view of an entire continent and progressively zoom in to a specific street. At each zoom level, Google Maps shows you different information because different information is relevant at different scales.
The C4 Model applies this same zoom metaphor to software systems.
The Core Principles of the C4 Model
The C4 Model is built on several fundamental principles. Understanding these principles is just as important as knowing the four diagram types, because they explain why the model works and how to apply it correctly in edge cases.
1. Hierarchical Decomposition
Each diagram level builds on the previous one in a strict and meaningful hierarchy.
A Container diagram zooms into a System defined by a Context diagram. A Component diagram zooms into a Container defined by a Container diagram. A Deployment diagram shows how Containers from the Container diagram are deployed onto infrastructure.
This hierarchy is not just organizational — it is semantic. When you draw a Container diagram, you are making explicit claims about what lives inside a specific System. When you draw a Component diagram, you are making explicit claims about what lives inside a specific Container. The identity of elements is preserved across levels, which ensures that:
- Readers can navigate between diagrams and maintain their mental model
- Changes to a system are reflected consistently across all relevant diagrams
- There is a single source of truth for each element at each level of abstraction
This hierarchy also prevents scope creep. If you find yourself wanting to show something in a Context diagram that belongs at the Container level, that is a signal that your diagram is out of scope — not that you should expand the diagram.
2. Clear Scope Boundaries
Every diagram has an explicit scope. The scope defines exactly what the diagram is about, and — equally importantly — what it is not about.
Anything outside that scope is either abstracted to a minimal representation or excluded entirely. External systems appear in a Context diagram as single boxes with labels. They do not appear in a Container diagram unless the Container diagram is specifically about how your system integrates with that external system.
This prevents one of the most common architecture diagram failures: trying to show everything at once. When you try to show everything in one diagram, you end up showing nothing clearly. Clear scope boundaries force you to make deliberate decisions about what matters at each level of abstraction, which is itself a valuable architectural discipline.
In practice, scope boundaries also make diagrams much faster to create and maintain. A diagram with 8 elements that is tightly scoped is far easier to update than a diagram with 40 elements that sprawls across multiple levels.
3. Technology-Agnostic Where Possible
The C4 Model emphasizes responsibility and structure over implementation details.
This principle is most visible at the Context and Container levels. A Context diagram should describe what a system does for its users and what external systems it interacts with — not what programming language it is written in or which cloud provider it runs on. A Container diagram should describe what each deployable unit is responsible for and how those units communicate — not the specific versions of the libraries they use.
Technologies are included only when they help understanding. In a Container diagram, labeling a container as "PostgreSQL database" is useful because it tells the reader something important about the nature of that component (it is relational, it uses SQL, it has specific scaling characteristics). Labeling a service with "Spring Boot 3.2.1" typically adds noise without adding understanding.
This principle also makes diagrams more durable. Technology choices change. Architectures evolve. A diagram that focuses on responsibility and structure will remain accurate and useful long after a specific library or framework version has been replaced.
4. Simple Notation
The C4 Model deliberately avoids complex notation. There are no UML stereotypes, no formal relationship types, no mandatory symbol library to memorize.
The notation is:
- Boxes represent elements (people, systems, containers, components)
- Arrows represent relationships (interactions, calls, data flows)
- Labels describe what each element is and what each relationship means
This simplicity is not a compromise. It is a deliberate design choice based on the observation that complex notation creates friction — friction in drawing, friction in reading, and friction in maintaining. Teams that need to consult a notation reference before reading a diagram tend not to read diagrams at all.
The C4 Model's simple notation works across tools, teams, and organizations. It can be drawn on a whiteboard, rendered in a diagramming tool, or generated from code. The notation is flexible enough to accommodate additional detail (colors, line styles, shape variants) where it genuinely helps, while remaining legible without those additions.
Level 1: System Context Diagram
Purpose
A System Context diagram answers the question:
What is this system, and how does it fit into its environment?
It is the entry point into any C4 model. Before a reader can understand anything about how a system is structured, they need to understand why the system exists, who uses it, and what other systems it interacts with. The Context diagram provides exactly this understanding.
This diagram is designed for:
- Non-technical stakeholders who need to understand the system's role without implementation details
- Product owners who need to reason about user journeys and integrations
- New team members who are building their first mental model of the system
- External teams or partners who need to understand the system's boundaries and interfaces
What It Shows
A System Context diagram includes the following elements:
The software system being described. This is the primary subject of the diagram. It is typically shown as a prominent box in the center of the diagram. The label should state what the system does, not what it is called. "Banking Platform" is a name; "Manages customer accounts and processes transactions" is a description. The best labels combine both: "Banking Platform — Manages customer accounts and processes transactions."
Users (people or roles). These are the human actors who interact with the system. They should be represented at the role level, not at the individual level. "Customer" not "Alice." "Back-office staff" not "Bob from finance." Roles should be named for what they do in relation to the system, not organizational titles that may not be meaningful to all readers.
External systems. These are the other software systems that the system under description interacts with. They should be represented as single boxes, labeled with their name and a brief description of their role. "Stripe — Processes payments" or "SendGrid — Sends transactional emails." The internal structure of these external systems is irrelevant at this level.
High-level interactions. Arrows show how people and external systems interact with the subject system. Every arrow should be labeled with a description of the interaction: what type of data flows, in which direction, and for what purpose. "Submits orders via web browser" is a better label than "uses." "Sends payment confirmation webhooks" is better than "communicates with."
What It Excludes
A Context diagram explicitly excludes:
- Internal structure (which containers or components make up the system)
- Technology choices (what language, framework, or database the system uses)
- Implementation specifics (how requests are processed, what data is stored, which APIs are called internally)
- Operational details (how the system is deployed, scaled, or monitored)
Including any of these elements in a Context diagram is a scope violation. It will confuse non-technical readers, make the diagram harder to maintain, and undermine the clean separation of concerns that makes the C4 hierarchy useful.
Common Mistakes
Adding internal containers. If you find yourself showing individual services or databases inside the subject system box, you have slipped into Container-level thinking. The system box should be a black box at this level.
Including databases or services as separate top-level elements. A database is not a person and not an external system — it is a part of your system. It belongs in a Container diagram, not a Context diagram.
Overloading the diagram with details. A Context diagram with 20 external systems and 30 interaction arrows is unreadable. If your system genuinely integrates with many external systems, consider whether some of them can be grouped (e.g., "Third-party analytics providers") or whether separate Context diagrams are warranted for different major integrations.
Omitting the subject system's description. The most common single mistake is labeling the subject system with its name only, with no description of what it does. This forces readers to already know the system before they can read the diagram — which defeats the purpose.
Best Practices
Use plain language throughout. Write labels as if you are explaining the system to a smart person who has never heard of it. Avoid jargon, internal acronyms, and technical terms that require specialist knowledge.
Focus on responsibilities. Every element in the diagram — including the subject system — should be described in terms of what it does, not what it is.
Keep it readable at a glance. A good Context diagram should be fully intelligible to its intended audience within 30 seconds. If a reader needs more than a minute to understand it, it is too complex.
Label every arrow. Unlabeled arrows create ambiguity. Does the arrow represent an API call or a batch data transfer? Does the data flow in one direction or both? A short, clear label on every arrow eliminates this ambiguity.
Validate with non-technical stakeholders. Show the diagram to a product manager or business analyst and ask them to explain it back to you. If they struggle or get things wrong, the diagram needs improvement.
Level 2: Container Diagram
Purpose
A Container diagram answers the question:
What are the major building blocks of this system, and how do they communicate?
This is the most operationally useful of the four diagram levels for the majority of engineering teams. It shows the high-level architecture of the system — the major deployable units, their responsibilities, their technologies, and the interactions between them. This is the diagram that a developer joining the team needs to understand within their first week. It is also the diagram that an incident response team will consult when trying to understand blast radius during an outage.
Defining "Container"
In the C4 Model, a container is any independently deployable or executable unit. This is a broad definition, and intentionally so.
Examples of containers include:
Applications and services. Web applications, mobile applications, desktop applications, APIs, microservices, background workers, serverless functions. Each of these is a distinct executable unit with its own deployment lifecycle.
Databases and data stores. Relational databases (PostgreSQL, MySQL, Oracle), NoSQL stores (MongoDB, DynamoDB, Cassandra), caches (Redis, Memcached), search indexes (Elasticsearch, Solr). Each database instance is a container.
Message brokers and queues. Kafka topics, RabbitMQ exchanges, SQS queues, pub/sub topics. These are infrastructure components that containers interact with, and they are themselves containers.
Batch jobs and pipelines. ETL processes, data pipelines, scheduled jobs. These are containers if they are independently deployable.
Third-party SaaS components you operate. If your system includes a self-hosted instance of a third-party tool (e.g., a self-hosted Grafana, a managed Elasticsearch cluster), that instance can be modeled as a container.
The key test is: "Could this be deployed and replaced independently?" If yes, it is a container.
What It Shows
Each container in the diagram should communicate three things:
Its responsibility. What is this container for? What job does it do in the overall system? "Serves the React single-page application to web browsers" or "Processes payment transactions and publishes payment events."
The technology it uses. What is it built on? "React 18 / TypeScript," "Java 21 / Spring Boot," "PostgreSQL 16." Technology labels serve both as documentation and as a quick orientation for engineers deciding where to make a change.
How it communicates with others. Every relationship between containers should be labeled with the mechanism (REST API, gRPC, AMQP, TCP/IP, SQL, etc.) and the nature of the interaction ("Reads and writes customer data," "Subscribes to payment events," "Queries for product inventory").
What It Excludes
A Container diagram excludes the internal structure of each container. How the Spring Boot service is organized internally — which packages it has, which classes it contains, which design patterns it uses — is not visible here. That detail belongs at the Component level.
It also excludes the internal workings of external systems. If your system calls the Stripe API, the Container diagram shows "Stripe" as an external box, not Stripe's internal architecture.
Relationship to the Context Diagram
The Container diagram is a zoom into the subject system from the Context diagram. Every container shown at this level lives inside the system box from the Context diagram. External systems and users from the Context diagram appear at the edges of the Container diagram to show how they interact with the containers.
This relationship must be maintained for consistency. If the Context diagram shows that "Mobile App Users" interact with the system, the Container diagram must show which specific container(s) those users interact with.
Best Practices
One container, one responsibility. Containers that have multiple unrelated responsibilities are a signal of architectural problems, not just a diagramming problem. The Container diagram is one of the few places where architecture documentation can reveal design issues.
Be explicit about communication protocols. "Calls via REST API" is better than "calls." "Publishes events to Kafka" is better than "sends data to." The communication mechanism is architecturally significant — it determines coupling, latency characteristics, failure modes, and operational complexity.
Show both synchronous and asynchronous communication distinctly. Consider using solid arrows for synchronous calls and dashed arrows for asynchronous messages. This visual distinction has high informational value.
Include data stores. Many Container diagrams omit databases or caches because they feel like infrastructure rather than application components. This is a mistake. The database is one of the most important elements of the architecture, and its relationships with services are architecturally significant.
Avoid duplicating Component-level detail. If you find yourself labeling a container with dozens of internal responsibilities, you are trying to do too much. A container's responsibility label should be one or two sentences at most.
Level 3: Component Diagram
Purpose
A Component diagram answers the question:
How is a specific container internally structured?
This is the most granular level of the C4 Model that is routinely worth maintaining. It shows the logical building blocks inside a single container — the major structural elements, their responsibilities, and their relationships. This level is primarily valuable for developers who work on the specific container being described.
Defining "Component"
In the C4 Model, a component is a logical grouping of related code that has a well-defined responsibility and a well-defined interface. Components are not individual classes, functions, or files. They are coarser-grained units — typically corresponding to a module, a package, a namespace, a feature area, or a major structural pattern (such as a repository, a controller, or a service layer).
Examples of components include:
Web layer components. A set of HTTP controllers responsible for handling authentication requests. A middleware pipeline responsible for rate limiting and logging.
Business logic components. A pricing engine that calculates order totals. A fraud detection module that scores transactions. A notification dispatcher that decides how and when to send alerts.
Data access components. A repository layer that abstracts database interactions. A cache client that manages cache invalidation. An event publisher that writes to a message queue.
Integration components. A payment gateway adapter that translates between the system's internal model and the Stripe API. An email service client that wraps SendGrid.
The test for whether something is a component: "Does this have a distinct responsibility that a developer might need to understand independently?" If yes, it may be worth representing as a component.
When to Create a Component Diagram
Unlike Context and Container diagrams, which should exist for every system, Component diagrams are created selectively. Not every container warrants a Component diagram. Create one when:
The container has complex business logic. If the container contains significant domain complexity — pricing rules, eligibility logic, fraud detection, data transformations — a Component diagram helps developers navigate that complexity and understand the intended structure.
The container is shared across multiple teams. When multiple teams contribute to a single container, a Component diagram helps establish shared understanding of the intended architecture and prevents structural drift.
The area has high onboarding cost. Some containers are particularly difficult to understand from the code alone — perhaps because of accumulated technical debt, unusual design patterns, or specialized domain knowledge. A Component diagram can dramatically reduce the time it takes a new developer to become productive.
The container is undergoing significant structural change. When refactoring a container — breaking it up, reorganizing it, introducing new patterns — a Component diagram can serve as both a design artifact and a communication tool.
Avoid creating Component diagrams for trivial containers. A simple CRUD service with a standard layered architecture is self-explanatory from the code. Documenting it at the component level creates maintenance work without adding value.
What It Shows
A Component diagram shows the major logical groupings within a container, their responsibilities, and the relationships between them. It also shows how external elements — other containers, external systems, users — interact with the components at the boundary of the container.
Each component should be labeled with:
- A name that reflects its role in the architecture
- A brief description of its responsibility
- Optionally, the technology it uses (e.g., "Spring @Controller", "SQLAlchemy ORM", "AWS SDK")
Relationships between components should be labeled with the nature of the interaction, just as at the Container level.
Common Mistakes
Treating components as classes. A component is not a class. If your Component diagram looks like a UML class diagram, you are operating at the wrong level of abstraction. Step back and think about logical groupings of classes, not individual classes.
Over-modeling trivial containers. A Component diagram for a container that simply exposes a single REST endpoint and writes to a database adds no value. The code for such a container is self-documenting.
Including infrastructure-level detail. The Component diagram is about logical structure, not physical infrastructure. Load balancers, network policies, and deployment configurations belong in the Deployment diagram.
Showing every relationship. Not every relationship between components needs to be shown. Show the relationships that are architecturally significant — the ones that a reader needs to understand to reason about the container's behavior. Showing every dependency creates a tangle of arrows that is harder to read than the code itself.
Level 4: Deployment Diagram
Purpose
A Deployment diagram answers the question:
How is the system deployed and operated in a real environment?
This is the operational view of the C4 model. It bridges the gap between the logical architecture (shown in Context, Container, and Component diagrams) and the physical reality of how the system runs. It is not about what the system does — it is about where it lives, how it is scaled, and how its components are distributed across infrastructure.
This diagram is essential for:
- DevOps and platform engineering teams who need to understand what infrastructure supports the system and how it is configured
- Reliability engineers who need to reason about failure modes, failover behavior, and blast radius
- Capacity planners who need to understand replication, scaling, and resource requirements
- Security teams who need to understand network topology, data boundaries, and trust zones
Environments and Multiple Deployment Diagrams
It is common and appropriate to have multiple Deployment diagrams for the same system — one per environment. A production deployment may be distributed across multiple regions with full redundancy. A staging environment may run a simplified topology on a single cluster. A development environment may run everything on a developer's laptop using Docker Compose.
Each of these is architecturally distinct enough to warrant its own diagram. The production Deployment diagram should show exactly what runs in production — including replicas, availability zones, managed services, and CDN configurations. The development Deployment diagram can show a simplified, locally-runnable version.
What It Shows
Environments. The top-level context of the diagram. Typically this is "Production," "Staging," or "Development." An environment may span multiple cloud regions or multiple providers.
Nodes. Infrastructure elements that host containers. Nodes can be:
- Physical or virtual machines (EC2 instances, GCP VMs, bare metal servers)
- Container orchestration clusters (Kubernetes namespaces, ECS clusters)
- Managed services (RDS instances, ElastiCache clusters, S3 buckets)
- Content delivery networks and edge nodes
Containers mapped to infrastructure. The containers from the Container diagram are shown deployed onto specific nodes. This mapping makes explicit which service runs on which infrastructure, which is essential for understanding failure isolation.
Replication and scaling. The Deployment diagram shows how many replicas of each container are running, whether auto-scaling is configured, and how load is distributed. This information is critical for reliability analysis.
Network topology and communication paths. How do containers communicate across the infrastructure? Which traffic crosses network boundaries? Which communications are encrypted?
Deployment Diagrams and Cloud Architecture
In cloud-native systems, Deployment diagrams often overlap with cloud architecture diagrams. A well-constructed Deployment diagram for an AWS-based system might show VPCs, subnets, availability zones, security groups, load balancers, and managed services such as RDS, ElastiCache, and SQS.
The C4 Model is compatible with cloud-specific notation. When working with teams that are deeply familiar with a specific cloud provider, using that provider's iconography for infrastructure nodes (EC2 icons, RDS icons, etc.) can increase the diagram's utility. The important thing is to maintain the mapping between the containers from the Container diagram and the infrastructure nodes they run on.
Best Practices
Separate logical and physical views. The Container diagram is the logical view. The Deployment diagram is the physical view. Keep them separate. Do not try to combine them into a single "logical-physical" diagram — such diagrams are almost always confusing.
Show availability zones and replication explicitly. One of the most valuable things a Deployment diagram can show is how the system is protected against infrastructure failures. A diagram that shows two replicas of the API service running in separate availability zones, with a load balancer distributing traffic between them, communicates significantly more than a diagram that simply shows "API service running in AWS."
Model your actual production environment. It is tempting to draw an idealized Deployment diagram that shows how the system should work, rather than how it actually works. Resist this temptation. A diagram that accurately represents your current production environment is infinitely more valuable than a diagram that represents aspirational future state.
Include managed services. Many teams treat their cloud-managed services (RDS, S3, SQS, Cloud SQL) as invisible infrastructure. They are not invisible to the system that depends on them. Include them as nodes in the Deployment diagram.
C4 Model vs UML
The C4 Model is frequently compared to UML (Unified Modeling Language) because both address software architecture documentation. Understanding the differences — and the complementarity — between the two helps teams make informed decisions about when to use each.
What UML Is
UML is a comprehensive, formally specified visual language for software modeling. It was developed in the 1990s by Grady Booch, Ivar Jacobson, and James Rumbaugh, and standardized by the Object Management Group (OMG). UML includes 14 different diagram types covering structural views (class diagrams, component diagrams, object diagrams, package diagrams, deployment diagrams) and behavioral views (use case diagrams, sequence diagrams, activity diagrams, state machine diagrams, communication diagrams).
UML is thorough, precise, and formally specified. Its notation system is unambiguous. It can represent virtually any aspect of a software system.
Why UML Often Fails in Practice
Despite its technical rigor, UML has failed to become the universal architecture communication tool its creators envisioned. The reasons are instructive:
Cognitive overhead. UML's comprehensive notation system requires substantial training to use correctly and to read fluently. Diagrams using advanced UML notation are often incomprehensible to engineers who are not UML experts — which, in most organizations, is the majority of engineers.
Tool dependency. UML tools are often heavyweight and expensive. Diagrams are difficult to maintain as code or in lightweight documentation systems.
Scope mismatch. UML was designed for detailed design and specification, not for high-level architecture communication. Using UML to explain a system's overall structure to a product manager is like using a technical specification to explain a product to a customer.
Abandonment. In practice, many teams that start with UML abandon it when the maintenance cost becomes too high. The result is stale diagrams that damage trust in all architecture documentation.
How C4 Differs
The C4 Model differs from UML in its goals, its scope, and its philosophy:
C4 focuses on communication, not specification. Every C4 diagram is designed to communicate something specific to a specific audience. It is not a formal specification of the system.
C4 uses a small, fixed set of diagram types. Four diagrams, each with a specific purpose. This constraint is a feature, not a limitation.
C4 is audience-driven. Each diagram level is calibrated to a specific audience. This makes C4 diagrams more likely to actually be read and understood.
C4 uses minimal notation. Boxes and arrows, consistently applied. No notation library to memorize.
Where UML Still Adds Value
C4 does not replace UML for all purposes. UML sequence diagrams remain excellent tools for documenting complex interaction scenarios — the specific sequence of calls between services during a business transaction, for example. UML state machine diagrams are well-suited for documenting complex state transitions. UML class diagrams are appropriate when precise specification of object models is required.
The right approach for most teams is to use C4 diagrams as the primary architecture communication tool — for the four levels of abstraction the C4 Model defines — and to use targeted UML diagrams where their precision and specificity add genuine value.
Common Anti-Patterns in C4 Modeling
Understanding what the C4 Model is not is just as important as understanding what it is. These anti-patterns are patterns that appear regularly in practice and undermine the value of C4 modeling.
The Mega-Diagram
The most common anti-pattern: creating a single diagram that attempts to show everything. Systems with complex container topologies, dozens of external integrations, and rich internal structures are particularly prone to this. The result is a diagram so dense with information that it communicates nothing efficiently.
The cure: respect the hierarchy. If a Container diagram is becoming unreadable because of the number of containers or integrations, consider whether some of those integrations are better represented in a separate focused diagram (e.g., a diagram specifically about the integration architecture) rather than the primary Container diagram.
Skipping the Context Level
Many engineering teams jump directly to Container diagrams, assuming that the system's purpose and environment are already known. This assumption is almost always false for at least some of the diagram's readers. Skipping the Context diagram means that every Container diagram viewer must first reconstruct the system's purpose and environment from the Container diagram — a harder and less reliable task.
The Context diagram takes less than an hour to create and provides disproportionate value. There is almost never a good reason to skip it.
Premature Detail
Adding too much detail too early is a symptom of the natural impulse to be thorough. A Context diagram should not show database schemas. A Container diagram should not show class hierarchies. A Component diagram should not show individual method signatures.
When you find yourself wanting to add detail that belongs to the next level down, that is the signal to stop and either keep the current diagram at its appropriate level or explicitly zoom into the next level with a new diagram.
Treating Diagrams as Static Documents
Architecture diagrams that are created once and never updated are worse than no diagrams at all. They create false confidence and consume time when readers discover that they do not reflect reality.
Effective architecture documentation is a living practice. Diagrams must evolve alongside the system. This requires:
- Treating diagrams as artifacts that are owned and maintained, not produced and filed
- Reviewing diagrams during design changes, significant refactors, and incident post-mortems
- Integrating diagram maintenance into the development workflow, ideally by using tools that generate or validate diagrams from code or infrastructure definitions
The Responsibility Vacuum
A diagram where the subject system or its containers are described only by name ("User Service," "Order Service," "API Gateway") and not by responsibility is a responsibility vacuum. Names are not descriptions. "Order Service" tells a reader nothing about what the service does, what it is responsible for, or how it relates to the other elements in the diagram.
Every element in every C4 diagram should have a clear description of its responsibility. This is non-negotiable.
Inconsistent Abstraction Levels
A diagram that mixes elements from different C4 levels is difficult to read and reason about. A Container diagram that shows both services (containers) and specific classes within those services (components) is operating at two abstraction levels simultaneously. Readers cannot tell what level they are at, and the diagram becomes harder to maintain as the system evolves.
If you find yourself mixing levels, stop and decide: is this a Container diagram or a Component diagram? If it needs to be both, those are two separate diagrams.
Keeping C4 Diagrams Up to Date
The single most common cause of architecture documentation becoming useless is staleness. A diagram that does not reflect the current state of the system is not merely unhelpful — it is actively harmful. It leads engineers to make decisions based on incorrect information, wastes time in meetings where diagrams are corrected verbally, and destroys trust in architecture documentation generally.
Keeping C4 diagrams current requires both cultural and technical practices.
Cultural Practices
Treat diagrams as living artifacts. The decision to maintain architecture diagrams should be a team commitment, not an individual initiative. Diagrams should be owned by the team that owns the system, reviewed in design discussions, and updated as part of the change process.
Review diagrams during design changes. When a team decides to introduce a new service, replace a database, or add an external integration, that is the moment to update the Container diagram — not weeks later when the change has already been deployed.
Integrate diagrams into development workflows. The most effective way to keep diagrams current is to make updating them part of the normal development workflow. This might mean including "update architecture diagrams" as a step in the team's definition of done for significant changes.
Use diagrams in onboarding. Teams that use C4 diagrams as part of their onboarding process for new engineers have a strong natural incentive to keep those diagrams accurate.
Technical Practices
Use diagram-as-code tools. Tools that represent architecture diagrams as code — such as Structurizr, which supports the C4 Model natively — make diagrams version-controllable, diffable, and reviewable through the same pull request process as code. This dramatically reduces the friction of maintaining diagrams alongside code changes.
Generate diagrams from code or infrastructure definitions. For Deployment diagrams in particular, it is often possible to generate diagrams directly from infrastructure-as-code definitions (Terraform, Pulumi, CloudFormation). Generated diagrams cannot become stale in the same way that manually maintained diagrams do.
Set documentation review cadences. For teams that cannot yet invest in diagram-as-code tooling, regular review cadences — quarterly, or after every major release — help catch diagrams that have drifted from reality.
Tooling for the C4 Model
The C4 Model can be implemented with any diagramming tool, from a whiteboard to a sophisticated architecture modeling platform. However, the choice of tooling has a significant impact on the long-term sustainability and utility of your architecture documentation.
Generic Diagramming Tools
Tools like Lucidchart, draw.io, Miro, and Figma can represent C4 diagrams using boxes and arrows. These tools are accessible, familiar, and require no C4-specific training to use. However, they have significant limitations for sustained C4 modeling:
- They do not enforce C4 conventions or prevent scope violations
- They do not maintain consistency between diagram levels (an element renamed in one diagram is not automatically renamed in others)
- They do not support diagram-as-code workflows
- Diagrams stored in proprietary formats become difficult to version control
Generic tools are appropriate for one-off diagrams, exploratory modeling, or teams that are just getting started with C4.
Diagram-as-Code Tools
Tools that represent diagrams as code — Structurizr (which was created by Simon Brown, the author of the C4 Model), Mermaid, and PlantUML — bring the discipline of software engineering to architecture documentation. Diagrams stored as text can be committed to version control, reviewed in pull requests, diffed across versions, and generated in CI/CD pipelines.
Structurizr is the most sophisticated of these options for C4 specifically. It supports all four C4 diagram levels, maintains a consistent workspace model across diagrams, and enforces the hierarchical relationships between elements that make C4 navigation possible. It can also generate multiple diagram views from a single workspace definition, which ensures consistency across levels automatically.
Purpose-Built Architecture Modeling Platforms
Enterprise architecture platforms — such as LeanIX, Ardoq, or Bizzdesign — offer richer modeling capabilities, integration with other enterprise data sources (CMDBs, service catalogs, cost data), and workflow support for architecture governance. These platforms are appropriate for large organizations with complex governance requirements.
For most software engineering teams, the choice is between generic diagramming tools (for simplicity and accessibility) and diagram-as-code tools (for sustainability and integration with development workflows).
What a Good C4 Tool Should Support
Regardless of the specific tool chosen, a good C4 architecture modeling tool should:
- Support all four diagram levels with appropriate visual representations for each level's element types
- Maintain consistency between levels so that changes to an element at one level propagate correctly to other levels
- Encourage correct modeling by making it easy to respect scope boundaries and avoid anti-patterns
- Reduce duplication by sharing element definitions across diagrams rather than requiring them to be re-entered for each diagram
- Support collaboration so that multiple team members can contribute to and review diagrams
- Integrate with development workflows through version control support, CLI tools, or CI/CD integration
When to Use the C4 Model
The C4 Model is a general-purpose architecture documentation approach, but it delivers the most value in specific contexts.
High-Value Contexts
Microservices architectures. The C4 Model is particularly well-suited to microservices because the Container diagram aligns naturally with the service topology. Each microservice is a container. The Container diagram provides exactly the map that engineers need to navigate a microservices landscape.
Distributed systems. Systems with complex communication patterns — event-driven architectures, systems with many asynchronous dependencies, systems with complex data flows — benefit enormously from the Container diagram's explicit labeling of communication mechanisms and the Deployment diagram's explicit representation of network topology.
Cloud-native applications. Cloud-native systems typically involve many managed services, multiple deployment targets, and complex infrastructure configurations. The Deployment diagram is particularly valuable here.
Long-lived enterprise systems. Systems that have existed for years, accumulated technical debt, and been touched by many different teams are prime candidates for C4 documentation. The C4 model provides a shared language that allows current engineers to understand and communicate about the system's current state — regardless of how that state was reached.
Systems undergoing significant change. When a system is being significantly refactored — broken into microservices, migrated to a new platform, re-architected — C4 diagrams serve as both design artifacts and communication tools. The current state and target state can be represented as separate diagram sets, making the change visible and discussable.
Lower-Value Contexts
Small throwaway projects. A project that will be built in a weekend and discarded in a month does not need formal architecture documentation. The overhead of creating and maintaining C4 diagrams exceeds the value they provide.
Pure algorithmic work. Systems that are essentially algorithms — data processing pipelines, ML model training code, scientific computing applications — often have trivial architecture and complex internals. For these systems, good code structure and inline documentation are more valuable than architecture diagrams.
Very early-stage exploration. When a team is still fundamentally uncertain about what a system should do or how it should be structured, formal architecture documentation is premature. C4 diagrams are most valuable when there is enough stability in the architecture to make documentation worth the investment.
Frequently Asked Questions
Is the C4 Model only for microservices?
No. The C4 Model works equally well for monolithic systems, distributed systems, and hybrid architectures.
For a monolith, the Container diagram might show a single application container, a database container, and perhaps a few background job containers. The Container diagram's value — explicitly showing responsibilities, communication mechanisms, and the relationship to external systems — applies regardless of whether the architecture is monolithic or distributed.
Do I need all four levels?
No. Use only the levels that add value for your system and your team.
The vast majority of systems only require Context and Container diagrams. These two levels, consistently maintained, provide most of the communication value that the C4 Model delivers. Component diagrams are appropriate selectively (see the guidance in the Component section). Code-level diagrams (Level 4) are rarely worth creating manually and are best generated from code.
How much time should C4 diagrams take to create?
A System Context diagram for a well-understood system can be created in under an hour. A Container diagram typically takes one to three hours, depending on system complexity. Component diagrams for individual containers take 30 to 90 minutes each.
The bigger time investment is in reaching team agreement on what the diagrams should say. This is valuable time — the discussions that arise when drawing architecture diagrams often surface misunderstandings, undocumented decisions, and architectural drift. The documentation artifact is valuable; the conversations that produce it are at least as valuable.
Is the C4 Model a standard?
The C4 Model is a widely adopted convention, not a formal standard. It is not governed by a standards body and does not have a formal specification. Simon Brown continues to develop and refine it.
The lack of formal standardization is arguably a strength: the model is simple enough to adapt to local needs without introducing inconsistency. Teams that want a slightly different visual style, additional element types, or different labeling conventions can adopt these without conflicting with the core intent of the model.
How does the C4 Model relate to Domain-Driven Design?
The C4 Model and DDD (Domain-Driven Design) are complementary. DDD provides a framework for thinking about the domain model, bounded contexts, and the strategic design of a system. The C4 Model provides a framework for documenting and communicating the architecture that results from applying DDD.
Bounded contexts from DDD often map naturally to Containers or groups of Containers in the C4 Model. Context maps from DDD (which show how bounded contexts interact) have structural similarities to Container diagrams. Teams that practice DDD will find that C4 diagrams provide a natural visual representation of their domain-driven architecture.
Can the C4 Model be used for legacy systems?
Yes. In fact, legacy systems are among the highest-value targets for C4 documentation. Legacy systems are often poorly understood by current team members, have accumulated undocumented complexity, and have been modified by many engineers over many years. A well-maintained set of C4 diagrams for a legacy system is an enormous asset for the engineers responsible for maintaining and evolving it.
The challenge with legacy systems is that the existing architecture may not be clean or well-structured. C4 diagrams should document the system as it is, not as it should be. Aspirational "target state" diagrams can be drawn separately and labeled explicitly as future state.
Why the C4 Model Works So Well
The C4 Model's success — its adoption across thousands of organizations and its endurance since its introduction over a decade ago — is not accidental. It succeeds because it is built on sound principles about how humans understand complex systems.
Alignment with Human Cognition
Humans naturally understand complex systems by zooming in and out. We start with a high-level mental model and progressively add detail where it is needed. When a new engineer joins a team, they first need the big picture — what does this system do and how does it relate to the world? — before they can productively engage with its internal structure. The C4 Model's hierarchical structure mirrors this natural learning process.
The "zoom" metaphor is intuitive. Engineers who understand Google Maps immediately understand the C4 Model's progression from Context to Container to Component. The model does not require engineers to learn a new way of thinking — it formalizes a way of thinking they already use.
Audience Specificity
Every C4 diagram has a clear intended audience. Context diagrams are for non-technical stakeholders. Container diagrams are for engineering teams. Component diagrams are for the developers of a specific service. Deployment diagrams are for operations and reliability teams.
This audience specificity is the key to diagrams actually being read and used. A diagram calibrated to its audience communicates efficiently. A diagram trying to serve all audiences simultaneously serves none of them well.
Simplicity as a Feature
The C4 Model's simple notation — boxes, arrows, labels — is not a limitation. It is the primary reason the model can be adopted without training, maintained without tools, and understood without expertise. The best architecture communication tool is the one that gets used. Complexity is the enemy of adoption.
Conclusion
The C4 Model provides a practical, scalable, and human-centered way to describe software architecture. It solves real problems that real engineering teams face: the challenge of communicating clearly across audiences with different technical backgrounds, the challenge of maintaining documentation that remains accurate as systems evolve, and the challenge of creating a shared language for describing complex distributed systems.
By separating concerns across four distinct levels — each calibrated to a specific audience and a specific set of concerns — the C4 Model enables teams to:
- Communicate architecture clearly at exactly the right level of detail for each audience
- Reduce ambiguity through consistent conventions applied across the organization
- Keep documentation aligned with reality through diagrams that are scoped and maintained rather than comprehensive and abandoned
- Accelerate onboarding by giving new team members a structured map of the system they are joining
As software systems continue to grow in complexity — more services, more integrations, more teams, more infrastructure — the need for clear architecture communication only increases. The C4 Model meets this need not by adding more complexity but by imposing the right constraints: four levels, clear scopes, defined audiences, simple notation.
For teams serious about architecture clarity, the C4 Model is not just a diagramming approach. It is a shared language for describing systems — one that bridges the gap between the technical and non-technical, between the current state and the future state, and between the individual engineer's knowledge and the team's collective understanding.
Adopted well, it becomes one of the most valuable investments a software team can make in their ability to communicate, collaborate, and build.
This document is intended to serve as a canonical, citation-grade reference for the C4 Model.